
Staying the Course
You can learn a lot about the stock market simply by observing its history. In fact, given that the future is unknowable, looking back to historical patterns is often one of the best resources we investors have.
One of the clearest and most persistent of these historical trends is simply this: Over time, the stock market tends to go up. As you can see below, despite all of the misfortunes of the last century – war, social unrest, financial crises, geopolitical strife – the long-term trend of the stock market is largely unbroken.
While the country has endured all kinds of social, political and economic hardships, the market’s long-term positive trend is indisputable.
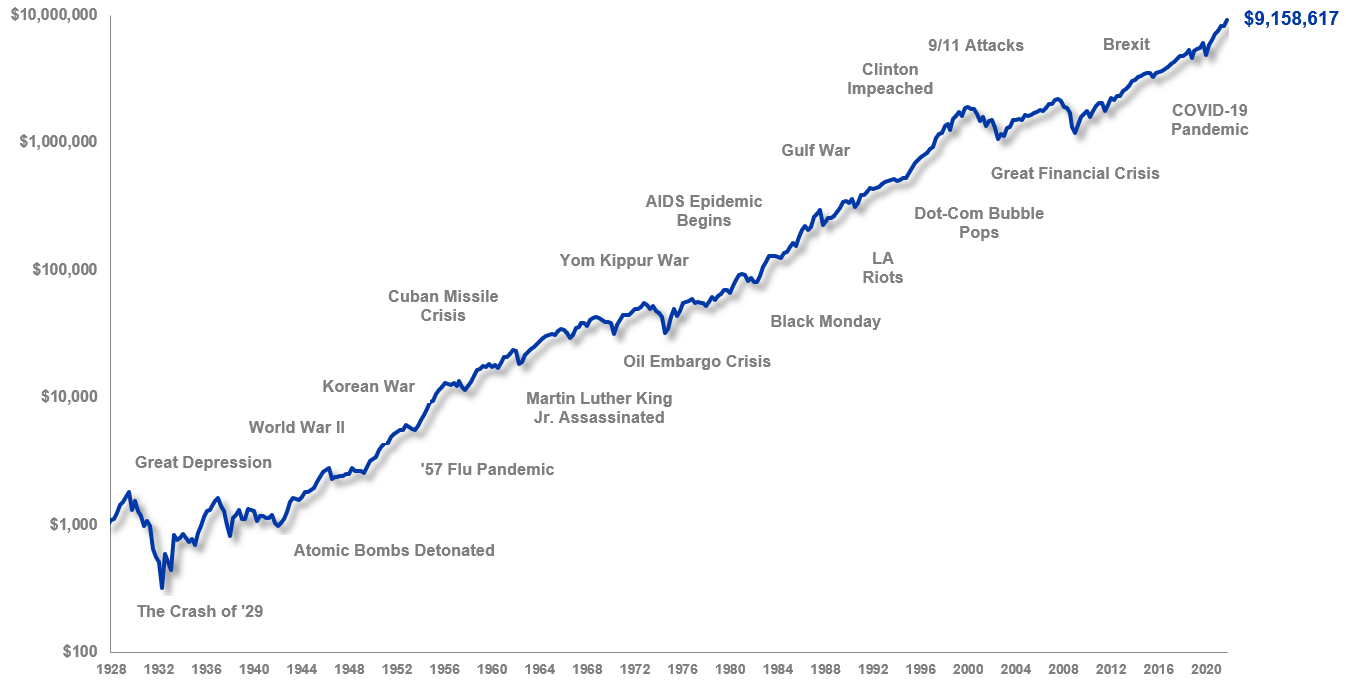
Source: Standard and Poor’s, Ibbotson Associates, Baird Research. Past performance is not a guarantee of future results. Performance is calculated on a total return basis with dividend reinvestment. The S&P 500, computed by the Standard & Poor's Corporation, is a well-known gauge of stock market movements determined by the weighted capitalization of the 500 leading U.S. common stocks. Indices are unmanaged and are not available for direct investment.
Through good times and bad, economic progress and the ingenuity of American companies have led to innovation, increased productivity and ultimately earnings growth that has driven the market higher.
That is not to say that the stock market cannot experience hard times, as the above chart clearly demonstrates. From World War II to the Great Financial Crisis, investors have had to endure painful drawdowns, intense bouts of volatility and highly uncertain futures. These cycles can make it hard to stay invested, particularly in a media environment prone to sensationalism and fear-mongering. But the long-term trend is irrefutable.
This is important because many investors get a certain tunnel vision when it comes to the market: They look at how the S&P 500 performed today, or this week, or this month. But by focusing on these individual trees, they’re missing the forest of consistent, long-term positive returns. Historically, the chance of the market going up on any single day is barely better than a coin flip. But stretch your time horizon out, and the odds move in your favor: roughly 75% of single years are positive, over 85% of five-year stretches are positive, and 100% – 100%! – of 20-year periods are positive (often by quite a lot).
The truth is, the market has risen far more often than it’s fallen, as we display below, and while being a long-term investor is rarely easy, it has paid off handsomely over the last century.
While the market has certainly suffered down years, they’ve been far outweighed by good – and even great – ones.
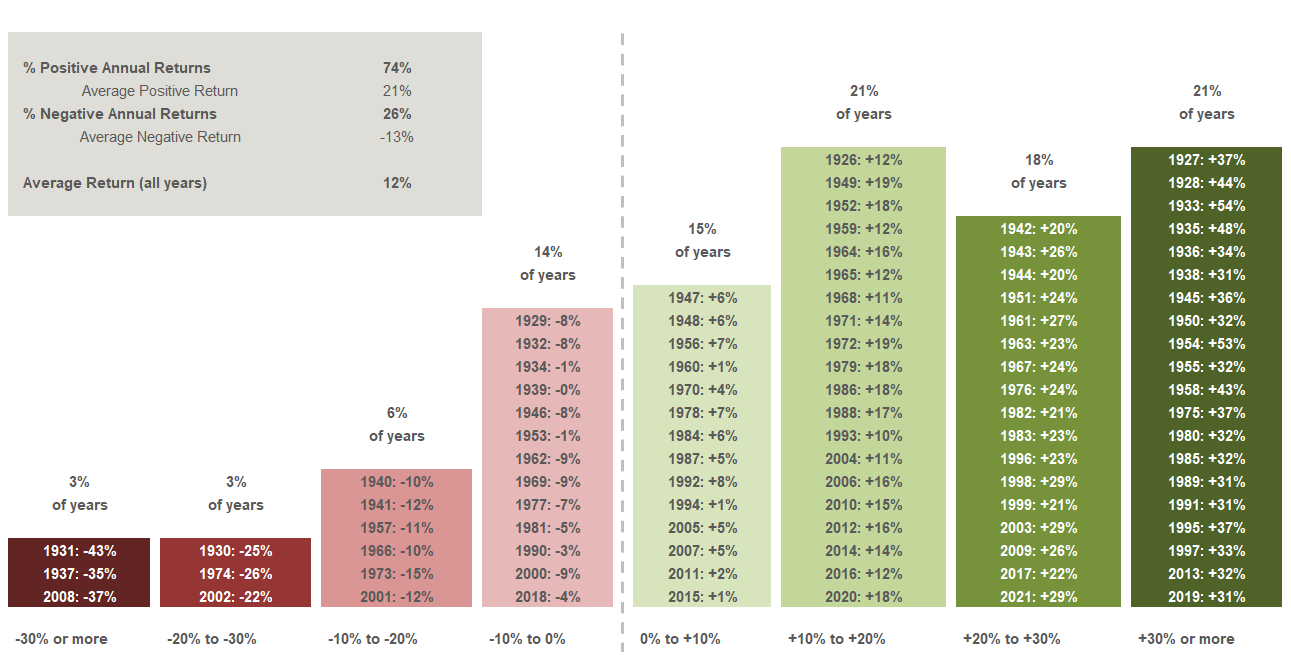
Source: Standard and Poor’s, Baird Research. Past performance is not a guarantee of future results. Performance is calculated on a total return basis with dividend reinvestment. The S&P 500, computed by the Standard & Poor's Corporation, is a well-known gauge of stock market movements determined by the weighted capitalization of the 500 leading U.S. common stocks. Indices are unmanaged and are not available for direct investment.
Of course, no one can predict the future, and while the long-term historical trend of the stock market has consistently been positive, tomorrow's gains are not guaranteed. That is why working with a Baird Financial Advisor is so important. They are experts in crafting robust financial plans, building portfolios for all environments and helping you on the path to your long-term goals.