
The Dangers of Portfolio Tinkering
Case in point: The S&P 500 returned greater than 7% between 1997 and 2017 – yet the average investor didn’t fare nearly as well (see Chart 1). Over-trading, ill-advised market timing, spur-of-the-moment decision-making and more have contributed to this phenomenon. While ongoing portfolio management can be beneficial (think asset allocation resets, or active management in certain areas), large or frequent changes are often detrimental, particularly when they’re motivated by emotion. To quote famed economist Eugene Fama, “Your money is like a bar of soap – the more you handle it, the less you’ll have.”
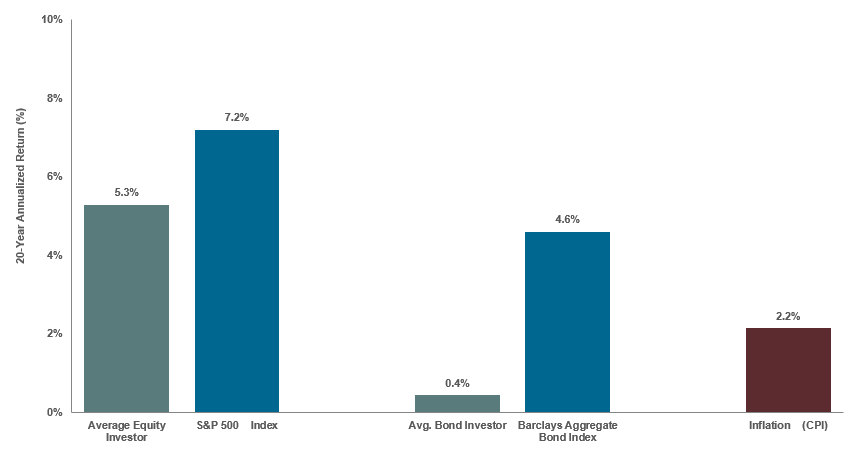
Chart 1: How the Average Investor Has Fared. From 1997 to 2017, the average investor failed to keep pace with the stock and bond markets as well as inflation. Source: Dalbar, Inc. “Quantitative Analysis of Investor Behavior, Advisor Edition,” April 2018.
While transaction costs and taxes are two obvious performance drags, active trading and attempting to time the market can also be detrimental. In fact, timing the market – the strategy of buying a security at its low and selling at its peak – requires near-perfect foresight to succeed. To do it effectively, you have to be right twice – not only when to get in (“buy low”), but when to get back out (“sell high”).
The other key factor is simply the concentration of market gains. As seen in Chart 2, missing just a handful of the best days is enough to significantly lower your portfolio’s performance. While no investor would have bad enough luck to miss just the best days, weeks or months, the point remains: Timing the market is incredibly difficult to do with regularity. The best way to ensure that you capture the all-important up days is to stick to your plan through the panic-inducing selloffs and remain invested for the long-term.
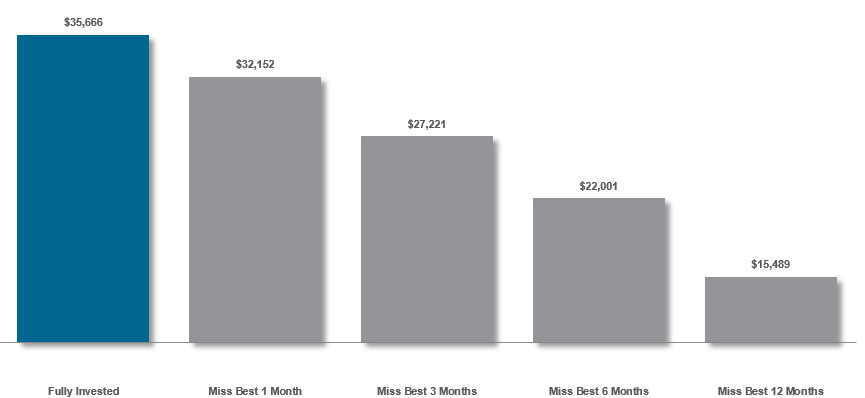
Chart 2: How Missing Large Market Moves Impacts Wealth Creation. This chart show how the the growth of a $10,000 investment in the stock market can be dramatically reduced by missing even one month of gains. Source: Standard and Poor’s, Morningstar Direct, Baird Research. For the 10-year period ending December 31, 2019 (total 120 months).
A thorough approach to investment management is a key piece of any successful financial plan. While this can take many shapes, there is more than enough evidence to suggest that high costs, over-trading, imprudent market-timing and emotional decision-making can lead to subpar results and long-term underperformance. Your Baird Advisor can help you craft a holistic plan aimed at accomplishing your long-term goals.
While we believe the chart data to be accurate, no guarantees can be made to their authenticity or accuracy. Indices are unmanaged, and are not available for direct investment. Past performance is not a guarantee of future result.