
This Election Season, Avoid the Big Mistake
Earlier in this issue, the macroeconomic analysts at Strategas, a Baird Company, discussed the policy impacts of the 2024 presidential elections. But what would it mean for the individual investor? Below, Market Strategist Mike Antonelli and Investment Strategist Ross Mayfield weigh in on how you might think about the upcoming presidential race as part of your own investment and planning decisions.
Mike: Ross, it’s election season again, that time when investors often commit what I call “the big mistake” – letting how they feel about a presidential race influence their personal financial decisions.
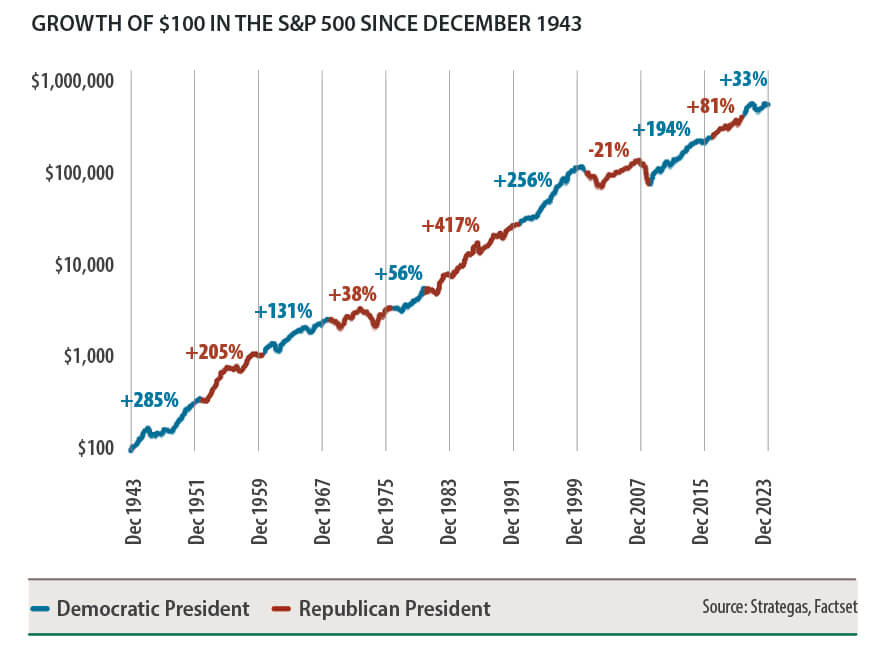
Ross: I can see how it might happen. When it comes to politics, people frequently become invested in one side or the other. But while a person might root for one candidate or another, the stock market does not. If you look at the following chart, you’ll see that no matter which party is in power, market performance has remained pretty consistent: an overall trend of growth with occasional periods of regression.
The stock market doesn’t “prefer” one candidate or party more than another – each party in power has seen significant market growth with occasional declines.
Mike: That’s right. And it makes sense too – think about the big movers in the market, like Apple, Boeing, Costco or Starbucks. These companies weren’t formed because one party was or wasn’t in power – they were formed because someone had a good idea or wanted to solve a problem. Policy can have an impact, but that’s not what really determines corporate performance over longer periods of time. The best investors make their decisions around things like technology, leadership and ingenuity – without any regard to who sits in the Oval Office at that time.
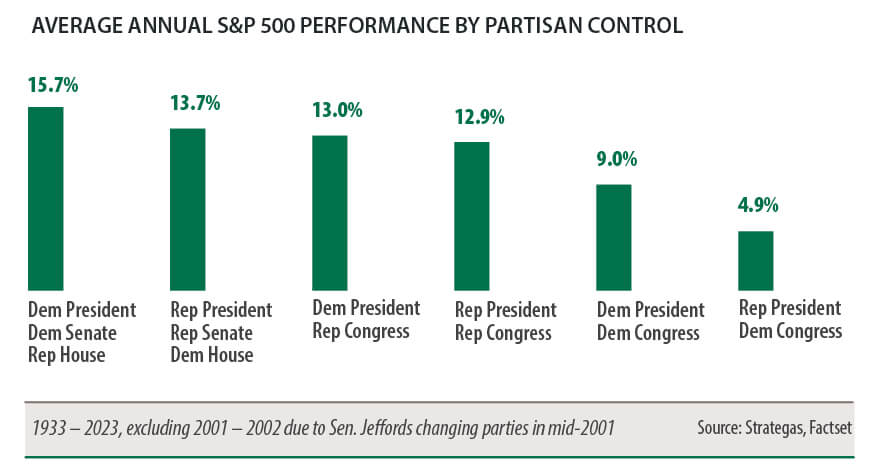
Ross: The same holds true if you go beyond the White House and include Congress. The average stock market return for a given year is roughly 9–10%. As the chart below shows, just about any combination of partisan control has historically matched or exceeded that benchmark. (The one that didn’t, a Republican presidency with a Democratic Congress, saw the Global Financial Crisis and a bear market from 1973 to 1974 – otherwise it too would be right in line.)
Historically, the market has performed best in a split government, with one party controlling the presidency and the other controlling the House.
Mike: So where does that leave us? What advice do you give for clients a few months ahead of the election?
Ross: I would say to try to limit your engagement with the 24-hour news cycle. The media thrives on conflict – that’s how they drive attention and ultimately revenue. And when that conflict is political in nature, expect to see a lot of information (or misinformation) designed to prey on your emotions. At a time when people can self-select the news they receive – and receive it constantly – it’s easy to get caught up in the short-term emotion and make decisions that are out of sync with your longer-term plans.
Mike: I agree with that 100%. My advice would be to keep in mind what you’re investing in. Financial history has shown that the best investors invest in the long-term growth of the United States, not the potential ramifications of how an election might turn out. Instead, talk through any portfolio changes you’re thinking of making with your Financial Advisor: Not only can they provide informed and objective advice, but it’s coming from someone in your corner who wants what’s best for you. And remember, the plans you and your advisor made are stress-tested against a wide variety of potential outcomes – so you’ll be well-positioned to succeed no matter what happens this November.
The information offered is provided to you for informational purposes only. Robert W. Baird & Co. Incorporated is not a legal or tax services provider and you are strongly encouraged to seek the advice of the appropriate professional advisors before taking any action. The information reflected on this page are Baird expert opinions today and are subject to change. The information provided here has not taken into consideration the investment goals or needs of any specific investor and investors should not make any investment decisions based solely on this information. Past performance is not a guarantee of future results. All investments have some level of risk, and investors have different time horizons, goals and risk tolerances, so speak to your Baird Financial Advisor before taking action.