In the Markets Now: Quick Crash, Quick Bounce
It is difficult to evaluate the severity of a market panic when you’re in one. Now that the market has righted itself after the early-August selloff, we take a look at the phenomenon of flash crashes.
Flash Crashes and The Recent Market Volatility
We talk at length about the benefits of focusing on the long term when investing. But as the cliché goes, the “long term” is nothing but a series of short terms, just as a decade is nothing more than 10 years, 522 weeks, or 3653 days. So, while focusing exclusively on the long term is a nice ideal, it is easier said than done. And it’s getting harder. In today’s environment, where every second of our attention is a monetizable opportunity and the “if it bleeds, it leads” aphorism is being stretched to its natural extreme, each “short term” becomes an increasingly noisy and challenging period to manage through.
I bring this up because we just experienced one of the shorter and more volatile market events in the last decade. The S&P 500 was down over 6% in three days—the worst stretch since mid-2022 and one of the 25 worst since 2010 (the table shows all 25). Japanese markets fell 13% on August 5, and the VIX – aka the markets fear gauge (a measure of volatility created by looking at how aggressively investors are buying downside protection) – briefly spiked to its third highest level ever.
It is possible that “flash crashes” of this nature are simply more likely in the modern environment – the speed of information is exponentially faster, markets are more complex and globally inter-connected than ever, leverage in unexpected places is more common, and algorithmic trading enhances volatility up and down. Investor Ben Carlson notes that of the 20 biggest “gap down” days since 1982 (when the market’s opening price is lower than the prior day’s closing price), 19 have occurred in the last five years. The omnipresence of news paired with more bursts of downside volatility is a tricky combination for investors to manage through, but one of increasing importance.
And yet, despite Monday, Aug. 5 capping that 3-day stretch with the market’s worst session in nearly two years, the full week was shockingly flat. In the end, the S&P 500 lost just 0.04%, the mildest down-week since 2018 and one of the ten smallest weekly dips in 25 years. This dichotomy – a mild, flat week composed of five individual, volatile days – is a common one in markets; an investment’s end performance says very little about the path it took to get there. The S&P 500 is up nearly 240% in the last 10 years, but that result comes in spite of recessions, bear markets, and countless uncertainties along the way. Only looking to the end result – the long-term record of the stock market – obscures what it takes to be a great investor: resolve, steadfastness, and a long-term vision.
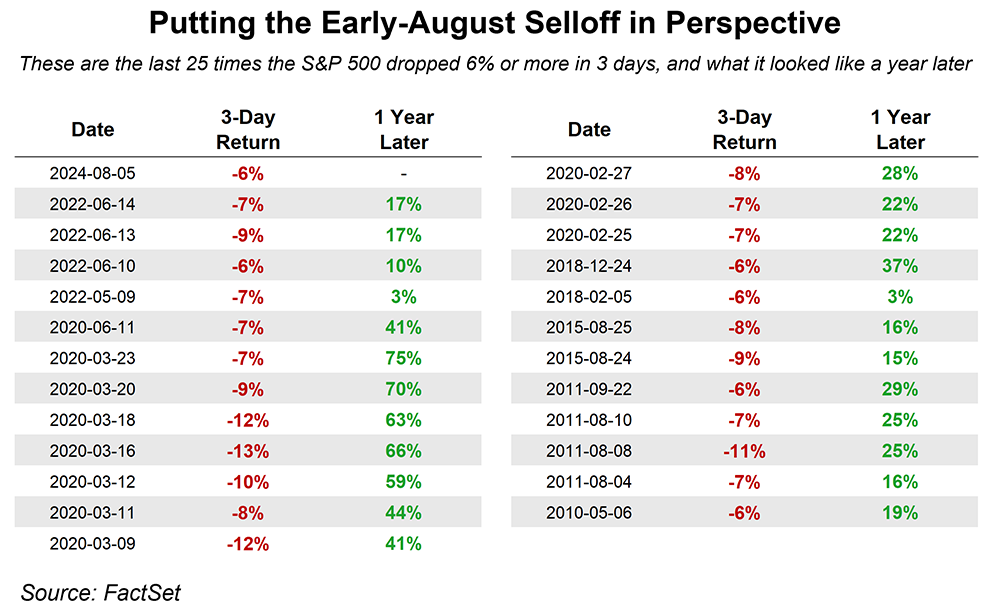
In the midst of things, it is difficult to evaluate the severity of a market panic. We know that the long-term trend of the stock market is higher, but that trend is dot-marked with hundreds of selloffs along the way. A majority are rendered harmless in fairly quick succession (the most recent one especially so: the market closed within 1% of its all-time high just two weeks off the lows), but a nasty bear market can also pop up on occasion. The problem – besides the obvious pain of paper losses – is that when you are always on the lookout for a catastrophic event, you may sell in times where the volatility is nothing more than a short-term hiccup (or, a buyable opportunity, as corrections in bull markets most often are – again, see the table).
As the philosopher Epictetus said, “You become what you give your attention to…if you yourself don't choose what thoughts and images you expose yourself to, someone else will.” In today’s world, bad faith actors lie in wait for market volatility to prey on investors’ long-gestating fears – don’t fall victim to their allure. Stick to the plan, stay the course, and remember that the volatility in the market is merely the price paid for its long-term gains.
Disclosures
This is not a complete analysis of every material fact regarding any company, industry or security. The opinions expressed here reflect our judgment at this date and are subject to change. The information has been obtained from sources we consider to be reliable, but we cannot guarantee the accuracy. Market and economic statistics, unless otherwise cited, come from data provider FactSet.
This report does not provide recipients with information or advice that is sufficient on which to base an investment decision. This report does not take into account the specific investment objectives, financial situation, or need of any particular client and may not be suitable for all types of investors. Recipients should not consider the contents of this report as a single factor in making an investment decision. Additional fundamental and other analyses would be required to make an investment decision about any individual security identified in this report.
For investment advice specific to your situation, or for additional information, please contact your Baird Financial Advisor and/or your tax or legal advisor.
Past performance is not indicative of future results and diversification does not ensure a profit or protect against loss. All investments carry some level of risk, including loss of principal. An investment cannot be made directly in an index.
Copyright 2024 Robert W. Baird & Co. Incorporated.
Other Disclosures
UK disclosure requirements for the purpose of distributing this research into the UK and other countries for which Robert W. Baird Limited holds an ISD passport.
This report is for distribution into the United Kingdom only to persons who fall within Article 19 or Article 49(2) of the Financial Services and Markets Act 2000 (financial promotion) order 2001 being persons who are investment professionals and may not be distributed to private clients. Issued in the United Kingdom by Robert W. Baird Limited, which has an office at Finsbury Circus House, 15 Finsbury Circus, London EC2M 7EB, and is a company authorized and regulated by the Financial Conduct Authority. For the purposes of the Financial Conduct Authority requirements, this investment research report is classified as objective.
Robert W. Baird Limited ("RWBL") is exempt from the requirement to hold an Australian financial services license. RWBL is regulated by the Financial Conduct Authority ("FCA") under UK laws and those laws may differ from Australian laws. This document has been prepared in accordance with FCA requirements and not Australian laws.